Audience
Small-team leads preparing a short check-in.
FICTIONAL CASE STUDY / Dashboard
See what the week is asking of you.
Make blocked tasks visible beside work already moving.
Try the design ↓
Small-team leads preparing a short check-in.
Every count needs a time period and a status label.
Status taxonomy, reporting summary and a linked task list.
FICTIONAL CONCEPT DESIGN
Three views of the Dayline interface.
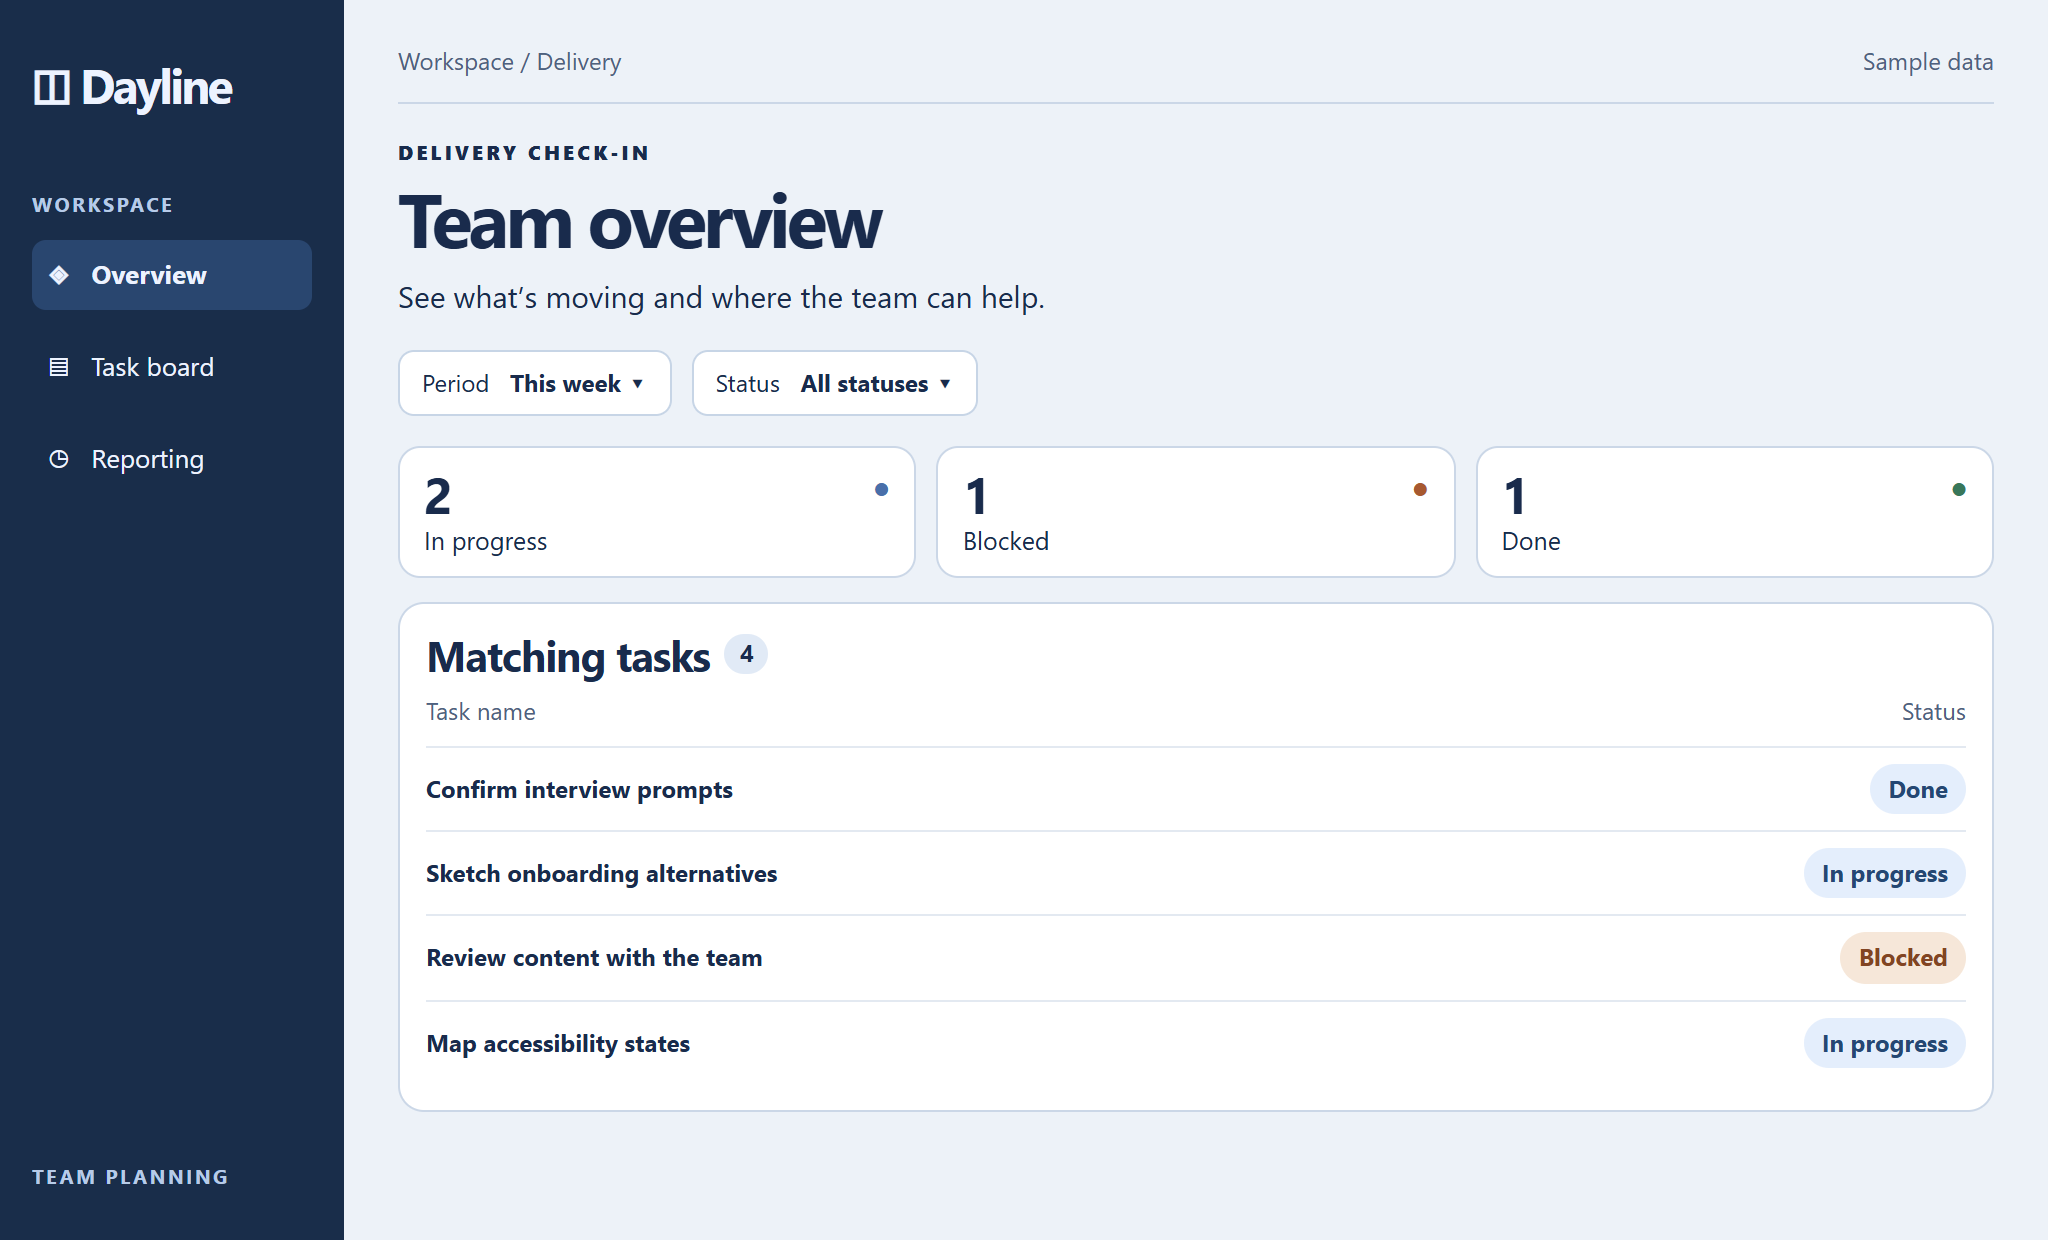
Status counts summarize the current reporting period. The task list below shows what contributes to those counts.
Open full size ↗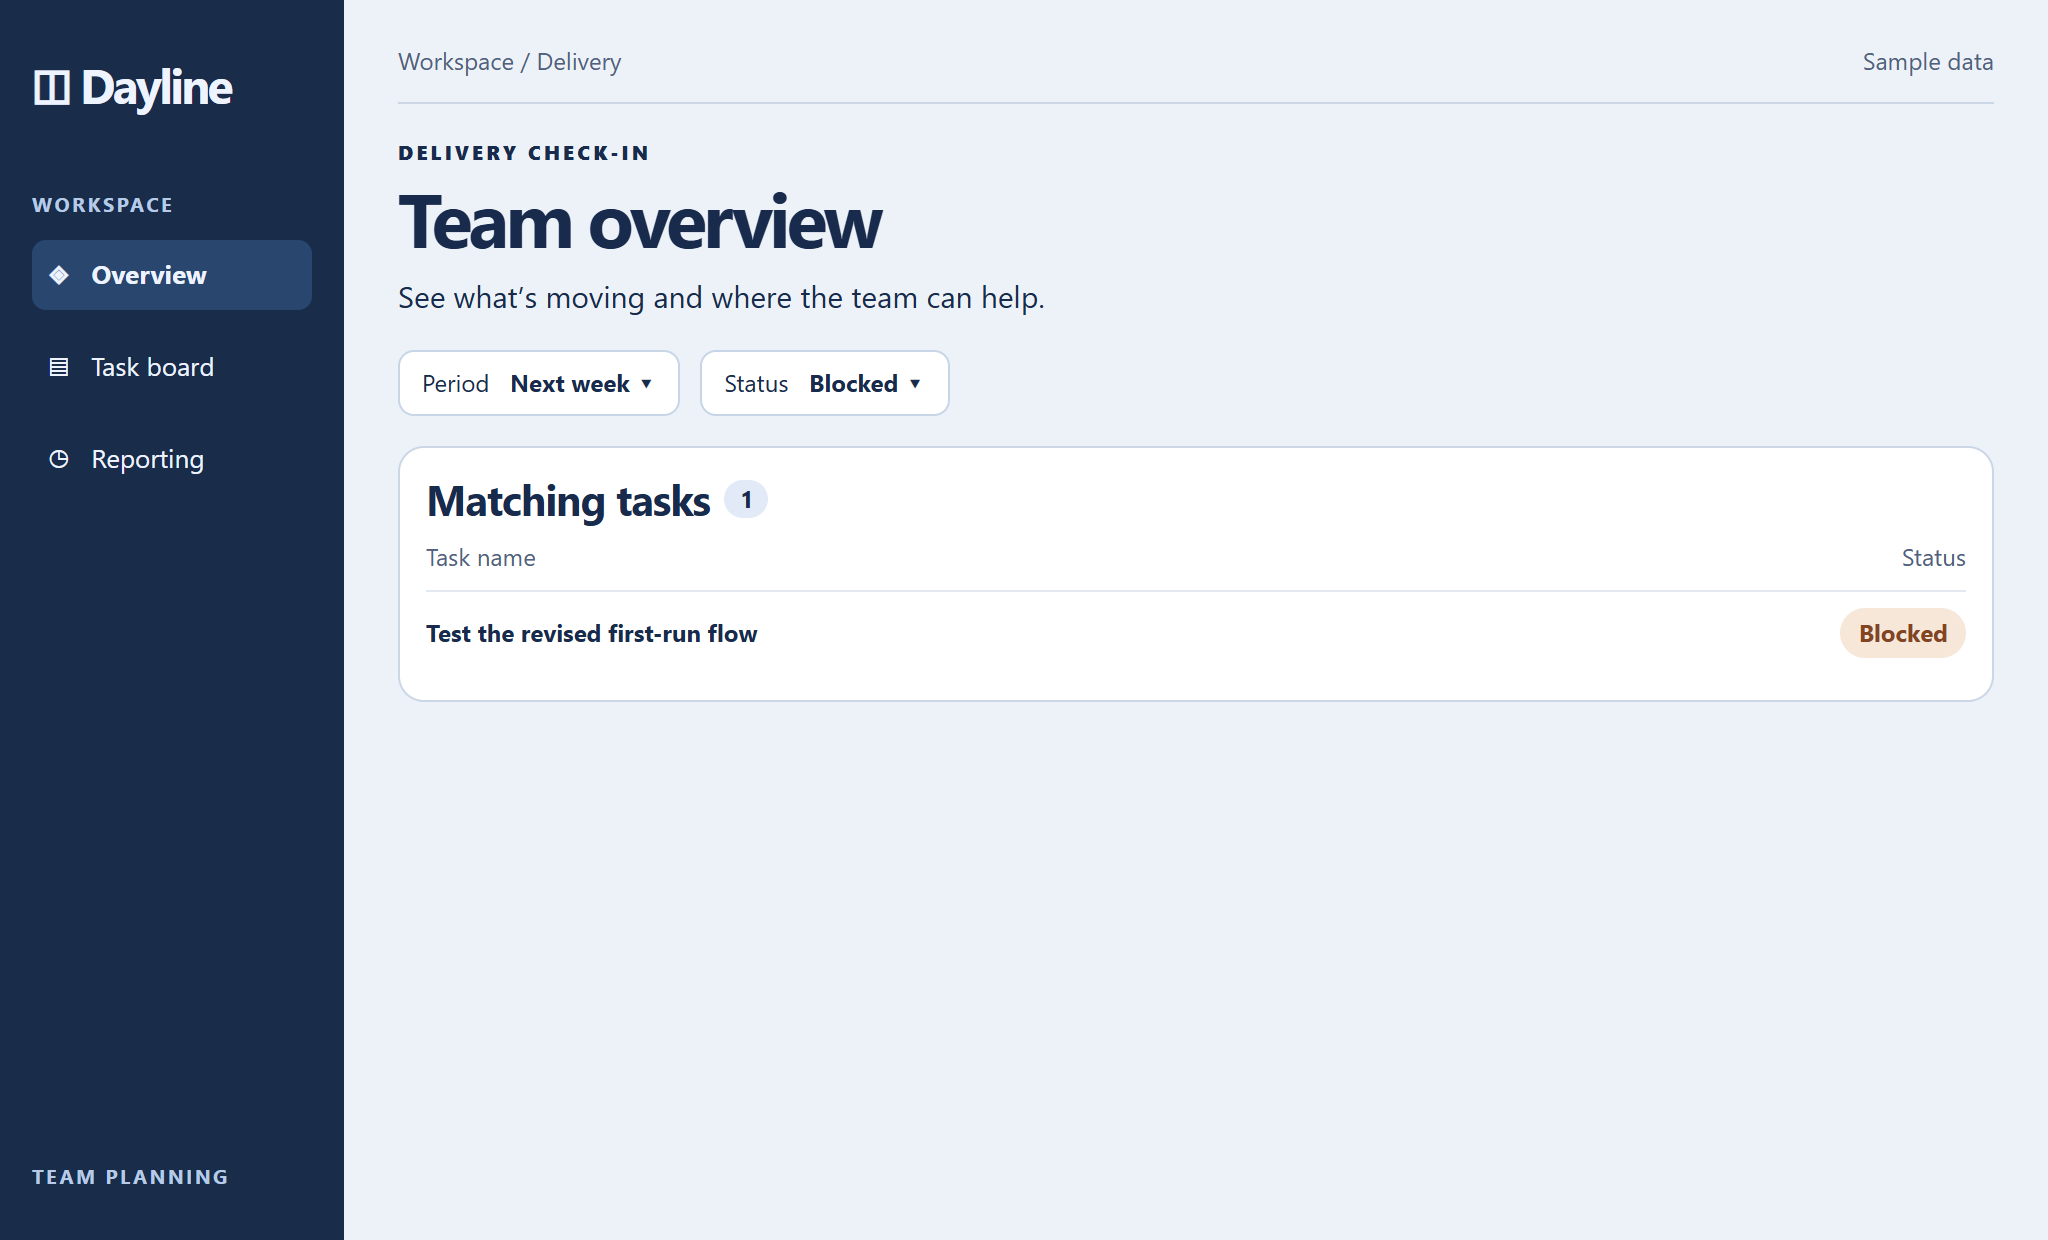
Both active filters stay in view, and the one matching task agrees with the summary count.
Open full size ↗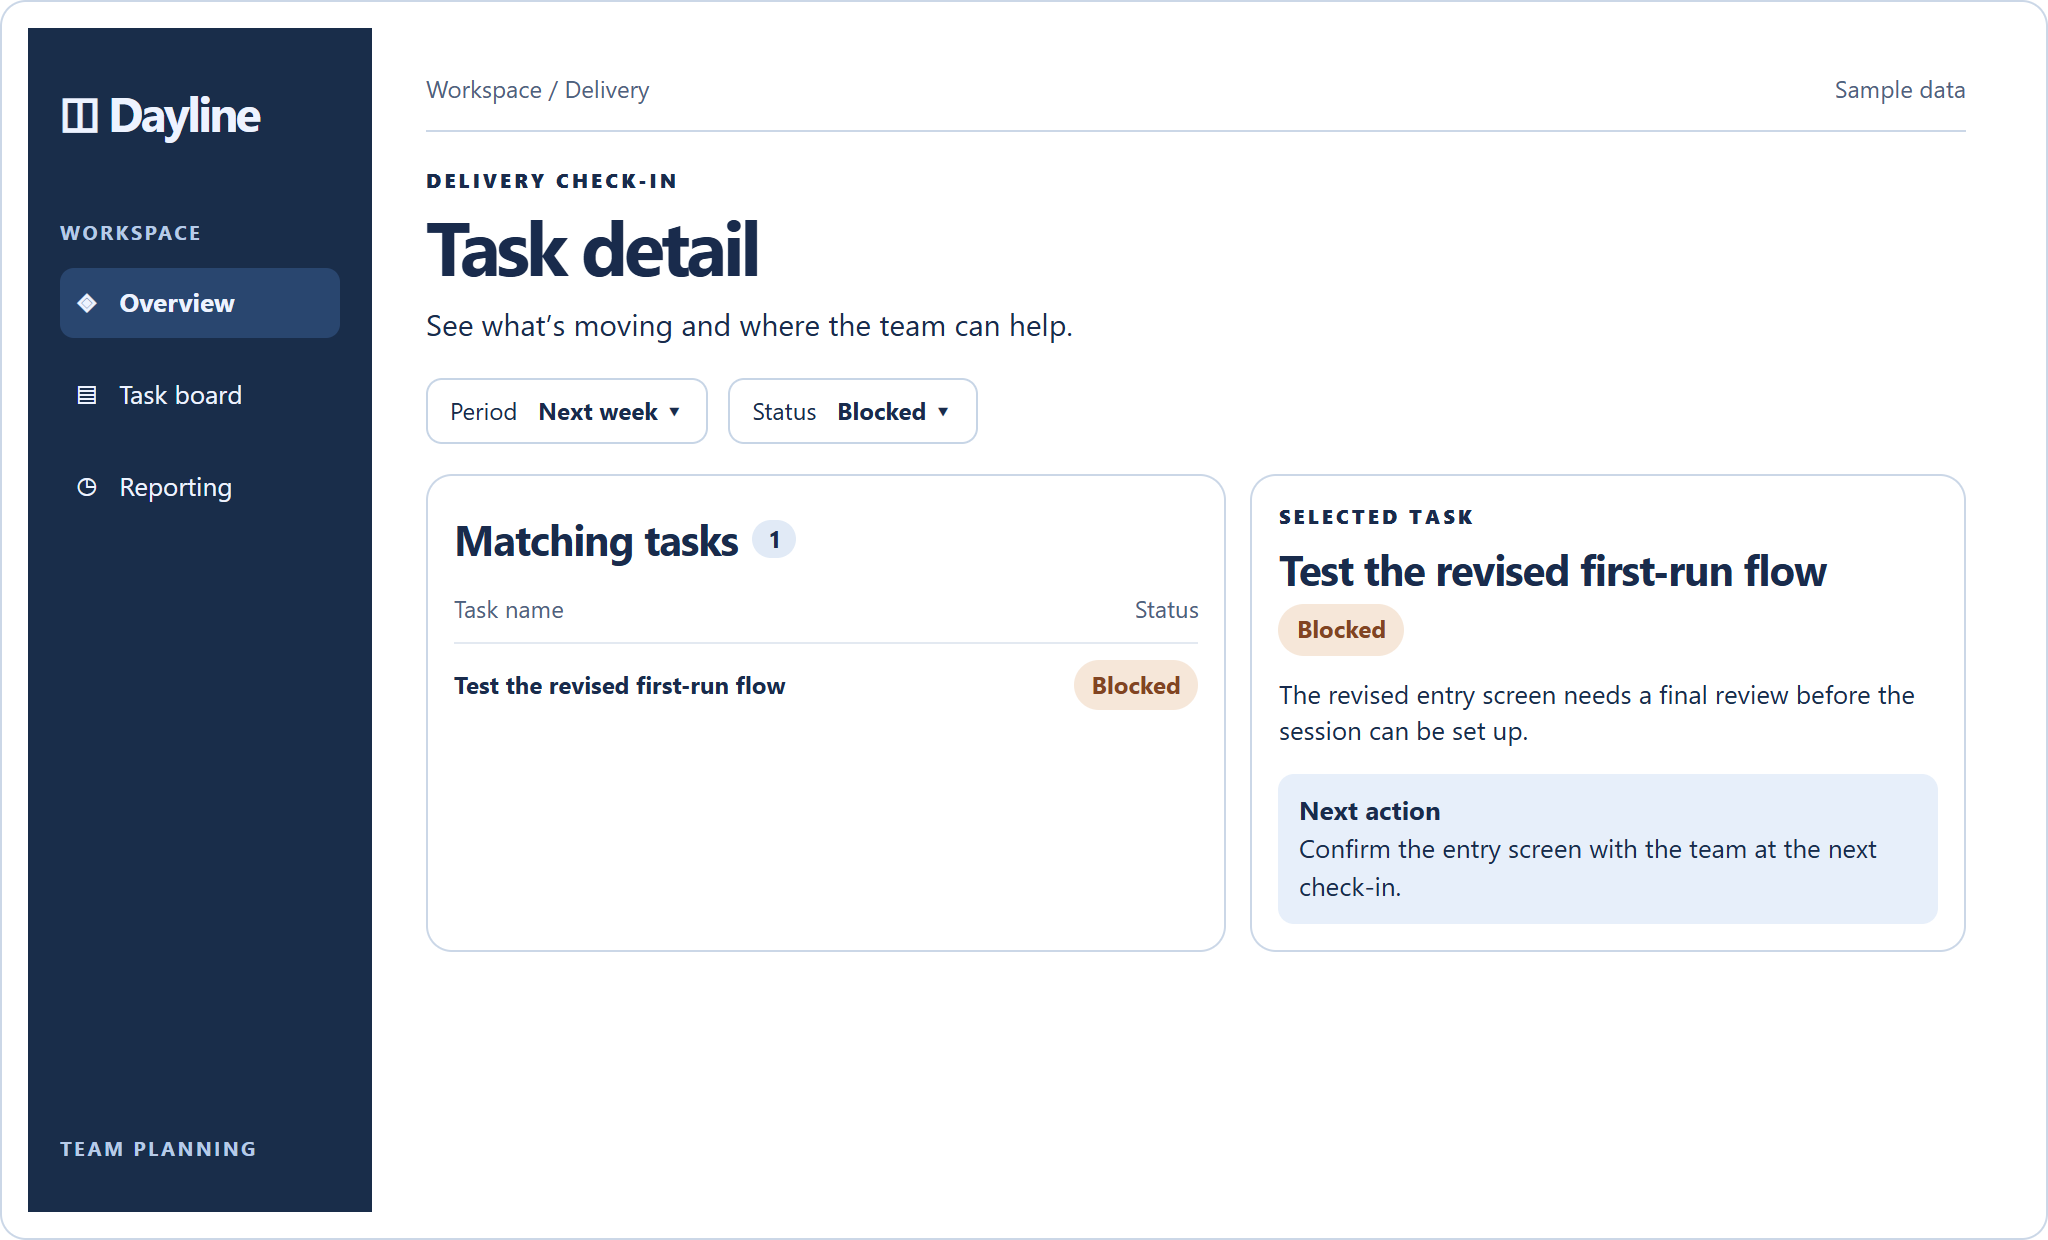
The blocked task opens beside its list. A next-action panel gives the team a concrete step for the check-in.
Open full size ↗TRY THE DESIGN
Switch to Next week, filter to Blocked and check the matching count and task.
Fictional design prototype with sample data. Changes stay on this page.

THE TRADE-OFF
A chart makes trends visible. A count paired with tasks supports specific follow-ups.
DESIGN NOTE 01
The summary describes the exact filtered list. Each change updates both together.
NEXT TEST
Ask someone to find next week’s blocked work and explain what the count includes.
KEEP EXPLORING